Posted by: Facebook – Sprout Social
Posted on: 4/19/2019
Despite efforts to unseat it, Facebook is still the reigning social media network. As of the end of 2018, it boasted over 2.32 billion monthly active users. The use of Facebook has evolved through the years so it’s important for marketers to be up to date on the newest statistics.
Here are the important stats for marketers to know, categorized by topic and ready for you to use in your social media strategy.
- Facebook demographic stats
- Facebook usage stats
- Facebook advertising stats
- Facebook video stats
- Facebook publishing stats
Facebook demographic stats
Who’s using Facebook now and where are they located? Get to know the demographics of the average Facebook user.
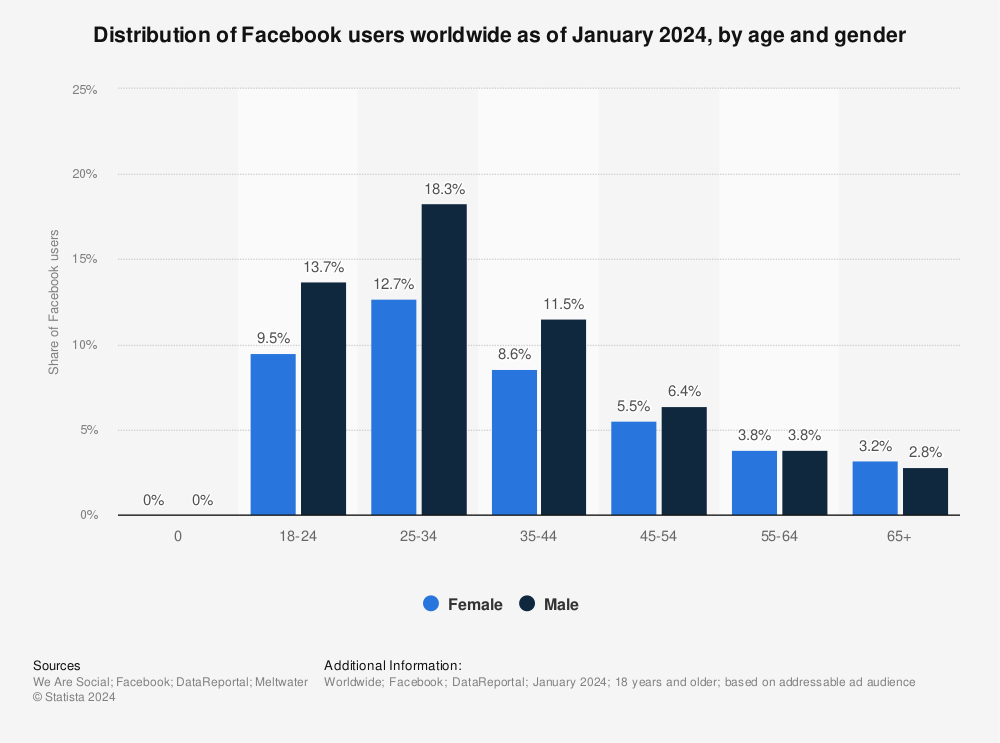
1. 13% of global active Facebook users are women ages 25–34
Broken down into gender and age categories, Statista found that the highest concentration of Facebook users were ages 18–44. The biggest demographic group is at 19%, men ages 25–34.
2. India has the highest number of Facebook users in the world
Surprise: the United States does not boast the highest number of Facebook users. As of January 2019, the highest number is India at 300 million users. The United States is a bit further behind at 210 million users.

3. 51% of teens use Facebook
If you’re trying to target teens, Facebook might not be your best bet. Only 51% of teens use Facebook, making it the fourth most popular social network. YouTube, Instagram and Snapchat all surpass Facebook in usage and popularity.
Facebook usage stats
Now that you know the core demographics of Facebook users, it’s time to understand how they use it.
4. 68% of Americans use Facebook
Second only to YouTube, the majority of Americans use Facebook online or on their phone, according to the Pew Research Center.
However, data shows that usage popularity is plateauing. Instagram is the next fastest growing network. If you had limited funds for advertising, these three networks should be at the top of your consideration.
That being said, your targeting data needs to take age into account. Both Snapchat and Instagram are more popular among those ages 18 to 24 than Twitter is. For Facebook, 80% of those ages 18–49 say they use the network. This casts a wide net of people on one network, which is ideal for those with smaller budgets.
5. 74% visit Facebook daily
If Facebook is one of the first things you log into when you wake up and one of the last things you see before you go to bed, you’re not alone. Of those who use Facebook, 74% of them log in daily. In fact, half of them actually check Facebook several times a day.
Understanding when your audience is on during the day helps you find the best times to post. You can find this engagement data through your Page Insights.
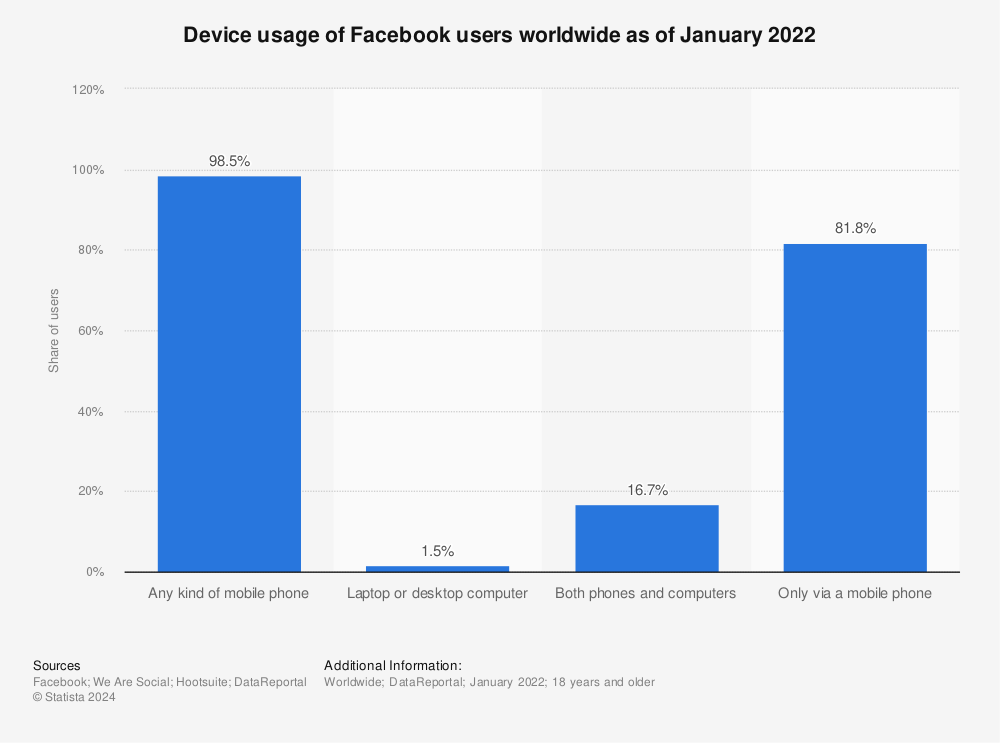
6. 96% of Facebook users access it on mobile
An overwhelming majority of Facebook users have accessed the network via tablet or smartphone, according to Statista. Because people access Facebook from a variety of devices, the percentage numbers are over 100%.
How can you use this to your advantage? When creating content and designing ads, always make sure that the mobile preview is set up correctly. If not, then uncheck the ad placement option for mobile.
7. 43% of users get their news from Facebook
When searching for content and news sources, social media and Google are at the top of the list for people. In fact, 43% report that they get their news from Facebook.

These stats indicate where marketers should place their most important information, such as company news and product releases.
8. Users spend an average of 35 minutes a day on Facebook
In the daily routine of an everyday user, social media use of time is only second to watching TV. In terms of social media, users spend an average of 35 minutes a day on the network.
As noted above, it’s very possible that these are multiple logins with different intention types. One login into Facebook may be for checking on friends while another could be for news.
9. At least 3% of Facebook profiles are fake
In 2018, Facebook released a report for Q1 that focused on the number of fake profiles on their platform. They noted that of the number of monthly active users they release, 3–4% of the profiles are fake. That’s about 88 million accounts that were removed.
The fake account number has changed throughout the years. In 2014, it was noted to be 7% while it was 14% in 2017. The crackdown in 2018 was likely in response to the high number created during the 2016 presidential election cycle.
For marketers, this number is good to know because it gives you an error range for your account’s likes and engagement numbers. While a good number of fake accounts are removed at creation, some do continue to create spam and fake impressions.
Facebook advertising stats
Facebook’s 2018 Q4 report reported an advertising revenue of $16.6 billion, which is a 30% increase year-over-year. This includes ads across Facebook Stories, Instagram feed, Instagram Stories and Messenger.
The report also indicated that the average price per ad decreased 2% while the number of ad impressions increased by 34%.
As a marketer, you probably don’t pay too much attention to earnings reports but you should check in on them every so often. Knowing that Facebook makes most of it revenue from advertising means that you have a lot of competition out there in your ad placement. It will always be in Facebook’s best interest to continue improving on their ad program.
For more insight into how much it costs to advertise on Facebook, check out our handy guide.
10. Average cost per click is $1.72
According to Wordstream, the average cost per click (CPC) for a Facebook ad is $1.72. This number changes across industries so be sure to check on your industry’s averages before setting $1.72 as your benchmark cost.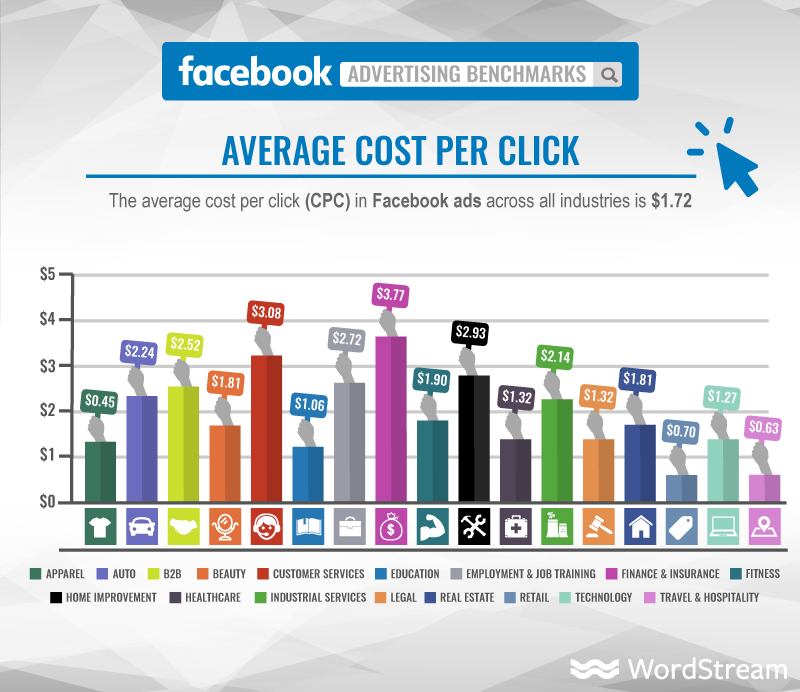
Knowing the average CPC helps marketers know if they’re paying too much for their advertising and if so, what they can do about it. It could be an issue with the content or the targeting. If the CPC is too high for you, consider other types of ads, such as paying instead for impressions.
Facebook video stats
Of its myriad of advertising content, Facebook videos still leads some of the most engagement. Facebook video content includes both videos uploaded to the network and Live-streaming videos. Its viewership is up to 8 billion views a day.
Here are some important stats to know about Facebook videos.
11. 85% of Facebook videos is watched without sound
As someone who has surely seen enough Facebook videos, you know already how important the first few seconds are in grabbing your attention. Imagery is so important for Facebook videos because 85% of its videos are watched without sound.
What should you focus on instead? Aside from cinematography, using text overlays, bold words and captions all go a long way.
NowThis and its media arms are well known for their news videos. The production is down to a science with identifiable branding and short text clips to get the point across.
Knowing this stat doesn’t mean you should ignore sound completely. It only means you should watch your video with and without sound to make sure all of your bases are covered. If you have narration, add your caption files so your silent viewers won’t miss out.
12. People spend 3x as much time watching a Live video than a pre-recorded one
Besides produced videos, Facebook’s Live streaming feature has taken off among both users and Pages. In fact, those who watch videos will spend three times as much time on a Live video than a produced one.
If your Facebook marketing strategy includes videos, Live ones are a must try, especially if your goal is more impressions and engagement. To make sure that your Live videos will be seen in real time, schedule posts beforehand to publicize just like you would any other event you host.
13. Video ad attention is 75% less for ages 18–24 than 65+
Video consumption differs across age brackets and this is true for both TV and Facebook ads. For the younger crowd ages 18–24, the attention span for ads is 75% less than for those who are ages 65+, according to Facebook’s own data.
This particular stat led to the network introducing in-feed ads with a cap of 15 seconds. Combine this with demographic data for your ideal video length. For example, your video ad would be much shorter for your younger crowd than for the older one. The younger crowd’s ad might also be more mobile oriented.
Facebook publishing stats
Last but not least, marketers need to know what the current stats are on Facebook publishing. How far do posts go organically and when is the best time to post?
14. Best time to post on Facebook is weekdays 10 am to 3 pm
Sprout’s guide to best times to post on every social network is an important read for marketers getting started on a new network. What days should you post for the most engagement?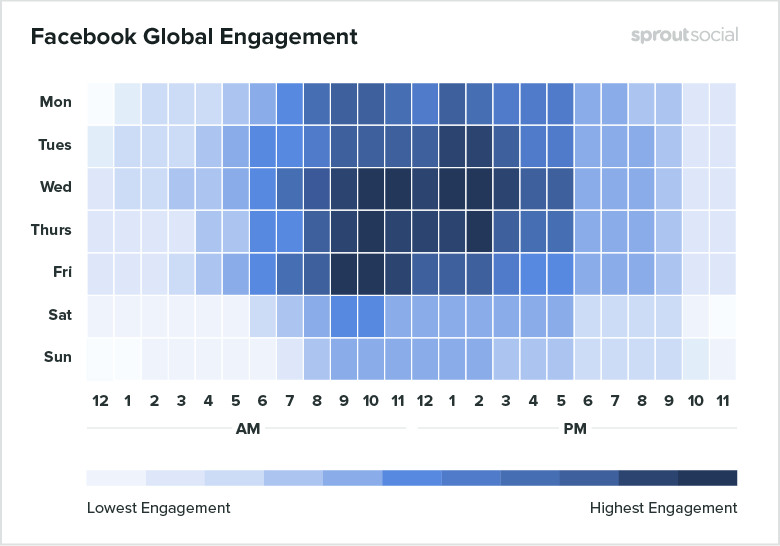
Our report shows that noon midweek is some of the most engaging time to post. Note that this report is an average across all collected data. The report does break it down into different page categories, so be sure to check out your industry.
15. Average organic reach is 6.4% of Page Likes
The average organic reach of Facebook Pages has been steadily dropping with every newsfeed algorithm update. A We Are Social report found that in 2018, the average organic reach is only 6.4% of its Page Likes.
The same study found that the average engagement rate over all the content types is 3.91%. Both stats were in a negative change from the previous quarter. To combat this, Pages turn to advertising.
Conclusion
Considering Facebook’s huge audience, it’s going to continue to be the focus of many social marketers in 2019. As Facebook evolves, audiences continue to change their behavior, such as where they access the network and what types of content they prefer.
With these statistics in hand, marketers can make some informed decisions on their Facebook marketing and advertising.
What are some of the stats you typically use for your Facebook marketing? Let us know your ideas in the comments.
This post 15 Facebook stats every marketer should know for 2019 originally appeared on Sprout Social.